Land Prices in Abidjan 2026: Why 3 Official Sources Give 3 Different Prices (and What That Reveals)

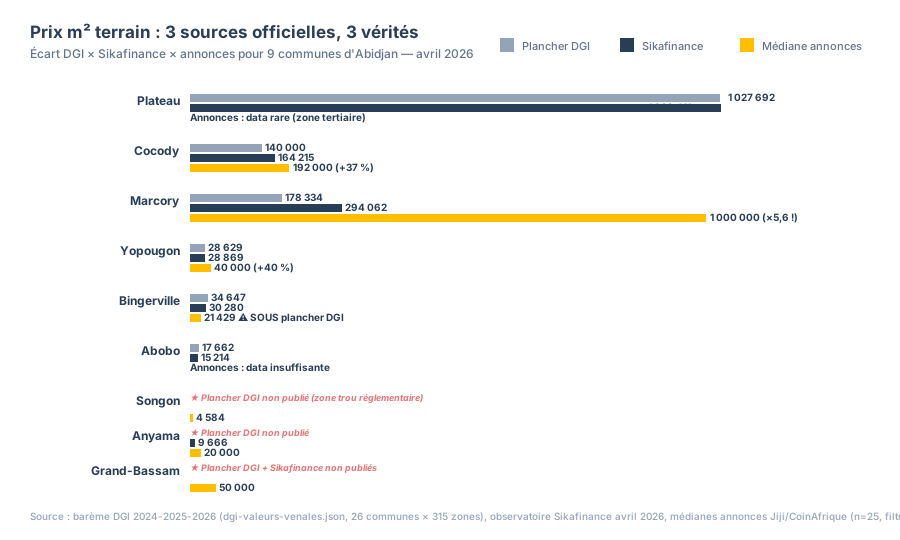
For the same plot in Marcory Zone 4, the DGI (Tax Authority) benchmark states 178,334 FCFA/m², the Sikafinance observatory reports 294,062 FCFA/m², and listings reach up to 1,000,000 FCFA/m². Who's right? All three. Breaking down the price gaps that can make or break a land investment.
Need a land expert?
Speak with an advisor for free. Response within 2 hours.
Key quotes
Three official sources, three different figures for the same plot of land. Here is what you need in hand before any negotiation.
- "In Marcory Zone 4, the median public listing price reaches 1,000,000 FCFA/m², while the median communal scale of the Direction Générale des Impôts (DGI, the tax authority) sits at 178,334 FCFA/m², a ×5.6 gap that reflects how concentrated the high end of one zone can be." Capital Foncier, calculation based on
dgi-valeurs-venales.json+ Jiji.ci, April 2026. - "In Bingerville, the median listing price (21,429 FCFA/m²) is below the DGI tax floor (34,647 FCFA/m²), which exposes the buyer to a reassessment of registration duties." Capital Foncier, cross-analysis.
- "The DGI scale of market values for undeveloped urban land 2024-2025-2026 serves as the tax floor for property tax (1.5% of the value) and for transfer duties (4% of the sale price, article 760 of the General Tax Code)." Direction Générale des Impôts, Market Values Manual 2024-2025-2026.
In brief
Three public sources document the price of urban land in Ivory Coast (Côte d'Ivoire): the DGI scale, which sets a tax floor (2024-2025-2026 edition), the Sikafinance observatory, a published private measurement, and the listings on the Jiji and CoinAfrique portals, which show the real private supply. For a single municipality, these three sources diverge, sometimes by a wide margin. In Marcory, listings exceed the communal DGI scale by ×5.6 (the Zone 4 effect). In Bingerville, they fall below the DGI floor, which raises a question about the title regime, with village attestations widely in circulation. In Songon, Anyama, and Grand-Bassam, the 2024-2025-2026 DGI scale does not exist yet: these fast-growing areas are a regulatory blind spot. Reading the three sources together is how you see the gaps before you sign.
Why three prices for the same plot of land?
A piece of land always has three values, depending on who is looking at it:
- The tax floor, which is what the State uses as a minimum taxable base.
- The public measurement, which is what an observatory reports from aggregated transactions or listings.
- The asking price, which is what a seller posts on a Jiji or CoinAfrique listing.
These three numbers do not measure the same thing, and the gaps between them are exactly what is worth examining. A buyer who looks at one source only is buying blind.
Key figures: 2026 triangulation by municipality
| Municipality | DGI floor (FCFA/m²) | Sikafinance observatory | Median listings | Gap DGI ↔ listings |
|---|---|---|---|---|
| Plateau | 1,027,692 | 1,029,411 | n/a | ≈0% (1) |
| Cocody | 140,000 | 164,215 | 192,000 | +37% |
| Marcory | 178,334 | 294,062 | 1,000,000 | +461% |
| Yopougon | 28,629 | 28,869 | 40,000 | +40% |
| Bingerville | 34,647 | 30,280 | 21,429 | −38% |
| Abobo | 17,662 | 15,214 | n/a | n/a |
| Songon | not published | n/a | 4,584 | n/a |
| Anyama | not published | 9,666 | 20,000 | n/a |
| Grand-Bassam | not published | n/a | 50,000 | n/a |
Source: DGI scale 2024-2025-2026 (via Capital Foncier's dgi-valeurs-venales.json), Sikafinance observatory, medians calculated from Jiji.ci and CoinAfrique listings (sample of 25 listings, April 2026).
How to read this table. "n/a" marks a figure absent from our sources; "not published" marks a municipality that does not appear in the DGI scale 2024-2025-2026. (1) For Plateau, no listing passed the filters of the sample, so the gap shown compares the DGI scale with the observatory, not with listings.
A Capital Foncier advisor checks the price you are being offered against the three public sources. Request my diagnostic, response within two hours.
Source 1, the DGI scale: a tax floor, not a market price
The scale of market values for undeveloped urban land is published by the Direction Générale des Impôts. For each zone of each municipality it sets a value per square meter, which then serves as the base for:
- the property tax on undeveloped land (1.5% of the market value per year);
- registration duties at purchase (4% of the sale price, with the scale as the floor, article 760 of the General Tax Code, or CGI);
- the levy on capital gains at resale (3.4% of the price, article 762 of the CGI).
How it is established: a communal commission proposes the values, an order from the Minister of Finance validates them, and the period covered runs three years (currently 2024-2026). The scale is public, and it can be consulted through the regional tax offices, notaries, and administrative portals.
What the DGI scale says (and does not say)
It says the tax minimum: no registered transaction can be taxed on a base lower than the DGI market value. It does not say the market price. Transactions are very often carried out above the scale, sometimes up to ×10 in premium areas. And it is frozen for three years, so the 2024-2025-2026 scale reflects observations made before its publication rather than the 2026 market as it stands.
Consequence for the buyer: if you are offered a plot at a price noticeably below the DGI scale, it is not a bargain. It is a warning signal, and it points to a precarious title (a village attestation), an unapproved subdivision, or an under-declaration that the tax administration will reassess.
Capital Foncier uses the V_DGI as a mandatory floor in its /estimer-mon-terrain simulator, for consistency with tax doctrine.
Source 2, the Sikafinance observatory: public measurement, partial methodology
Sikafinance publishes a table of land prices by municipality (sikafinance.com/immo/prix_terrains_ci) with three columns: min, max, average. A footnote credits "DGI/Cadastral Directorate" as the source.
What the observatory contributes
A consolidated view by municipality, easy to consult, with extreme bounds that give a sense of the range. It is also refreshed more often than the DGI scale, which stays frozen for three years, although the page carries no update date.
Its critical limitations
The methodology is not spelled out. Actual transactions? Aggregated listings? Direct observations? We do not know. The breakdown by neighborhood is missing almost everywhere: Cocody Riviera is isolated, Plateau is not split up. There is no distinction by type of title either. Within one municipality, a plot whose Definitive Concession Decree (ACD) is published at the Land Register and a plot sold under a village attestation land in the same average, even though the two do not stand on comparable legal ground. Finally, Songon, Grand-Bassam, and several outlying municipalities do not appear in the observatory at all.
Verdict: Sikafinance is useful as a quick triangulation, never as a single source. Cross-checked with the DGI scale and with listings, it takes on its real value.
Source 3, Jiji and CoinAfrique listings: private supply, display bias
Listing portals publish the prices sellers ask for. That is not the price of a completed transaction, it is an intention to sell.
What listings reveal
The real asking price on the market, at the moment it is displayed. Geographic granularity, down to the neighborhood and sometimes to the subdivision. And the type of title on offer: ACD, CPF, Land Title (TF), village attestation, sometimes "ACD in progress". That last mention deserves a careful read, because it means the procedure has started but publication at the Land Register has not taken place, so the deed is not yet enforceable against third parties.
Their major biases
A displayed price is not a transacted price: the final figure is often 5 to 15% lower after negotiation. Listing quality varies a great deal, between lots already sold several times over, duplicates, and fanciful prices. And the selection bias is structural, since only sellers who want visibility publish. Off-market deals, between members of the diaspora or inside developers' own portfolios, never show up there.
Capital Foncier's methodology: for each municipality, we calculate the median of at least five recent listings, less than 90 days old, after filtering out outliers (Tukey ×1.5·IQR). It is the measure that holds up best against extreme values.
The three signals triangulation reveals
Signal 1, Marcory: the communal average lies, go down to the zone
On paper, Marcory has a median DGI scale at 178,334 FCFA/m² and a Sikafinance observatory value at 294,062 FCFA/m². Listings, for their part, hover around 1,000,000 FCFA/m², which is 5.6 times the scale.
What is going on? Marcory is a heterogeneous municipality. Bia Sud and some working-class neighborhoods pull the communal average down, while Zone 4 and Bordure VGE are high-end zones that go past one million FCFA per square meter. The DGI scale knows this heterogeneity zone by zone, but the communal median hides it.
Practical rule: for any negotiation in Marcory, ask for the DGI value of the exact zone, not the communal average. The scale publishes grids zone by zone, and they have to be read at that level.
Signal 2, Bingerville: listings below the DGI floor, a tax warning signal
In Bingerville, listings show a median at 21,429 FCFA/m², whereas the DGI scale sets 34,647 FCFA/m² for this municipality.
What is going on? Bingerville has a high proportion of land sold with village attestations, precarious and unregularized titles, at very low prices. Those listings pull the median down. A vocabulary point: for urban subdivisions approved since 2023 this customary instrument has been replaced by the Attestation de Droit d'Usage coutumier (ADU, customary use right attestation), and on the urban fringe of Abidjan it circulates mostly as the trace of an unregularized subdivision. In tax terms, on the other hand, any transaction registered below the V_DGI will be recalculated by the administration on the basis of the scale: the buyer will pay registration duties and taxes on the DGI value, not on the displayed price.
Practical rule: if a plot in Bingerville is offered at a price per square meter clearly below the DGI floor, there are two possibilities. Either the title is precarious, a village attestation or an unapproved subdivision, and the price reflects that risk. Or the seller is after an under-declaration to reduce the duties. In both cases, verifying the nature of the title comes before any discussion of price.
Signal 3, Songon, Anyama, Grand-Bassam: the regulatory blind spot
The 2024-2025-2026 DGI scale does not cover some fast-expanding municipalities. Songon, a rapid extension zone of Greater Abidjan, is absent from the scale. Anyama, also expanding, is not covered. Grand-Bassam belongs to the Sud-Comoé region rather than the Abidjan district, and does not appear either.
Asking prices there are climbing fast all the same. Our reading of the portals over the last three years gives an order of magnitude of +15% per year: that is an internal observation, not a published statistic, and it should be taken as such. With no official tax floor, buyers and sellers negotiate without a public benchmark.
Practical rule: for these areas, Capital Foncier applies a proxy, the DGI value of the equivalent neighboring municipality. Songon ↔ Yopougon, Anyama ↔ Abobo, Grand-Bassam ↔ Port-Bouët. This proxy has no official tax standing, but it works as a coherent negotiation benchmark.
How to read the three prices in a real negotiation
Here is the method we apply when a member of the diaspora brings us a plot.
Step 1, identify the municipality AND the exact neighborhood
Not "a plot in Cocody". A plot in Cocody Angré 8th Tranche, or in Cocody Riviera M'Badon. The DGI scale publishes zone by zone.
Step 2, read the three prices for that zone
The DGI floor, meaning the published market value. The Sikafinance observatory when it is available, keeping in mind that it is a communal average. Then the median of current listings, five at least, outliers filtered out.
Step 3, calculate the two gaps
The gap between listings and the DGI, then the gap between listings and Sikafinance.
Step 4, interpret
| Situation | Interpretation |
|---|---|
| Listings ≈ DGI ≈ Sikafinance | Aligned market. Consistent negotiated price. |
| Listings >> DGI (e.g. Marcory Zone 4) | High-end zone. The communal scale is misleading, the real value of the zone is high. |
| Listings < DGI (e.g. Bingerville) | Warning: precarious title likely OR under-declaration being sought. Verify the nature of the title first. |
| DGI not published | Zone with strong recent development. Use a neighboring-municipality proxy. |
For the diaspora, triangulation as a first filter
Three reflexes for an investor at a distance.
- Never accept an advertised price without comparing it to the DGI scale. The scale is public, so anyone can check it, and that makes it the first line of defense against over-pricing.
- Be wary of "bargains" below the DGI floor. Most of the time that price reflects a real limitation of the property: a precarious title, a flood-prone zone, a heavy easement. When it does not, it is an under-declaration that will end in a reassessment.
- Ask a trusted third party to run the triangulation. A notary, a land advisor, or a specialized firm: the gap between the DGI scale and listings is a quick diagnostic that a professional can deliver in a few hours.
For the resident buyer, triangulation as a negotiating lever
If you are in Abidjan and negotiating directly:
- Come to the negotiation with the DGI figure in hand. It is a pricing argument: "the official scale is at X, why are you asking Y?" Serious sellers answer; opportunists back off.
- Use comparable listings as an anchor. "I have seen five similar listings at lower prices" carries more weight than negotiating with no reference.
- Never accept the phrase "this is a diaspora price". This expression, recurrent on the market, signals over-pricing aimed at buyers who are far away. The DGI scale and the listings are the same for everyone.
What Capital Foncier takes away from triangulation
The DGI floor is the low limit, not the market price, and buying below it exposes you to a tax reassessment. The Sikafinance observatory is a useful triangulation benchmark, never a single source. Listings remain the only indicator of the real market, provided you compute clean medians and stay critical about lot quality. Three municipalities call for extra caution, Songon, Anyama, and Grand-Bassam, because they have no DGI floor while they are developing fast.
Going further
- Full reference of DGI values by municipality (26 municipalities, 315 zones)
- Estimate your land's value with Capital Foncier's methodology
- Land transfer fees calculator
- Housing deficit: 827,753 units to build (macro context)
Securing your land project
A Capital Foncier advisor runs the triangulation of the three prices for the plot you are targeting within two hours, with a clear verdict: aligned market, over-pricing, or tax risk.
Request my diagnostic takes two minutes, with a response within two hours.
Sources
- DGI Manual of market values for undeveloped urban land 2024-2025-2026
- 2026 Tax Annex, Finance Act, DGBF
- DGI, Carrying out a real-estate transfer
- Sikafinance Observatory, Land prices in Ivory Coast
- Article 760 of the General Tax Code (registration duties)
- Listings sampled on Jiji.ci and CoinAfrique in April 2026 (n=25, 9 municipalities, Tukey ×1.5·IQR filtering)
About this article
Written by Alain Kadio, founder of Capital Foncier SARL, with the support of the editorial team and of the internal reference dgi-valeurs-venales.json (26 municipalities × 315 zones, 2023 version in effect for the 2024-2026 tax period).
Initial publication: May 1, 2026. Last data verification: April 24, 2026.
This article is intended for educational purposes. It constitutes neither legal advice nor individualized investment advice. Acquisition decisions must be based on a documentary verification of the plot concerned.
?Frequently asked questions
Why does the DGI price differ from the listing price?+
The DGI scale sets a minimum tax floor for three years, currently 2024-2025-2026. Listings reflect private supply in real time, influenced by demand, speculation, the type of title, and negotiation. The two do not measure the same thing.
Can I buy a plot below the DGI tax floor?+
Yes, but with two likely consequences. First, the tax administration will recalculate registration duties on the basis of the scale rather than the price paid, so you will pay more than you had planned. Second, it is a signal that the title is precarious or that the seller is after an under-declaration. In every case, an examination of the title is indispensable.
Are Sikafinance prices reliable?+
Sikafinance publishes a useful summary, but the methodology is not explained on the page. The figures are consistent for well-represented municipalities such as Plateau and Cocody, less so for outlying or heterogeneous ones. To be cross-checked systematically with the DGI scale and with listings.
Why are Songon and Anyama not in the DGI scale?+
The 2024-2025-2026 DGI scale covers 26 main municipalities of the Abidjan district and the regional capitals. Municipalities that have expanded sharply in recent years, Songon, Anyama, and the Grand-Bassam extensions, are not yet integrated. For these areas, Capital Foncier uses a neighboring-municipality proxy as a negotiation benchmark.
How do I calculate property tax from the DGI value?+
For undeveloped land, the annual property tax is 1.5% of the DGI market value. A 500 m² plot in Cocody with a V_DGI of 140,000 FCFA/m² is therefore taxed at 500 × 140,000 × 1.5% = 1,050,000 FCFA per year.
What happens if I buy at a price lower than the V_DGI?+
The tax administration recalculates registration duties (4% of the sale price, article 760 of the General Tax Code) on the basis of the DGI scale, not the displayed price. You will therefore pay higher duties than the contractual price suggested. This rule is known and applied regularly, so a buyer can anticipate it.
How often is the DGI scale updated?+
The official cycle is three years. The current version is 2024-2025-2026, and the next one takes effect in 2027. Between two revisions the values stay frozen even when the market moves, which is why it is worth cross-checking them against listings, which change continuously.