Construction and public works in the Ivorian economy: 4 to 5.5% of GDP over five years (2015-2020)
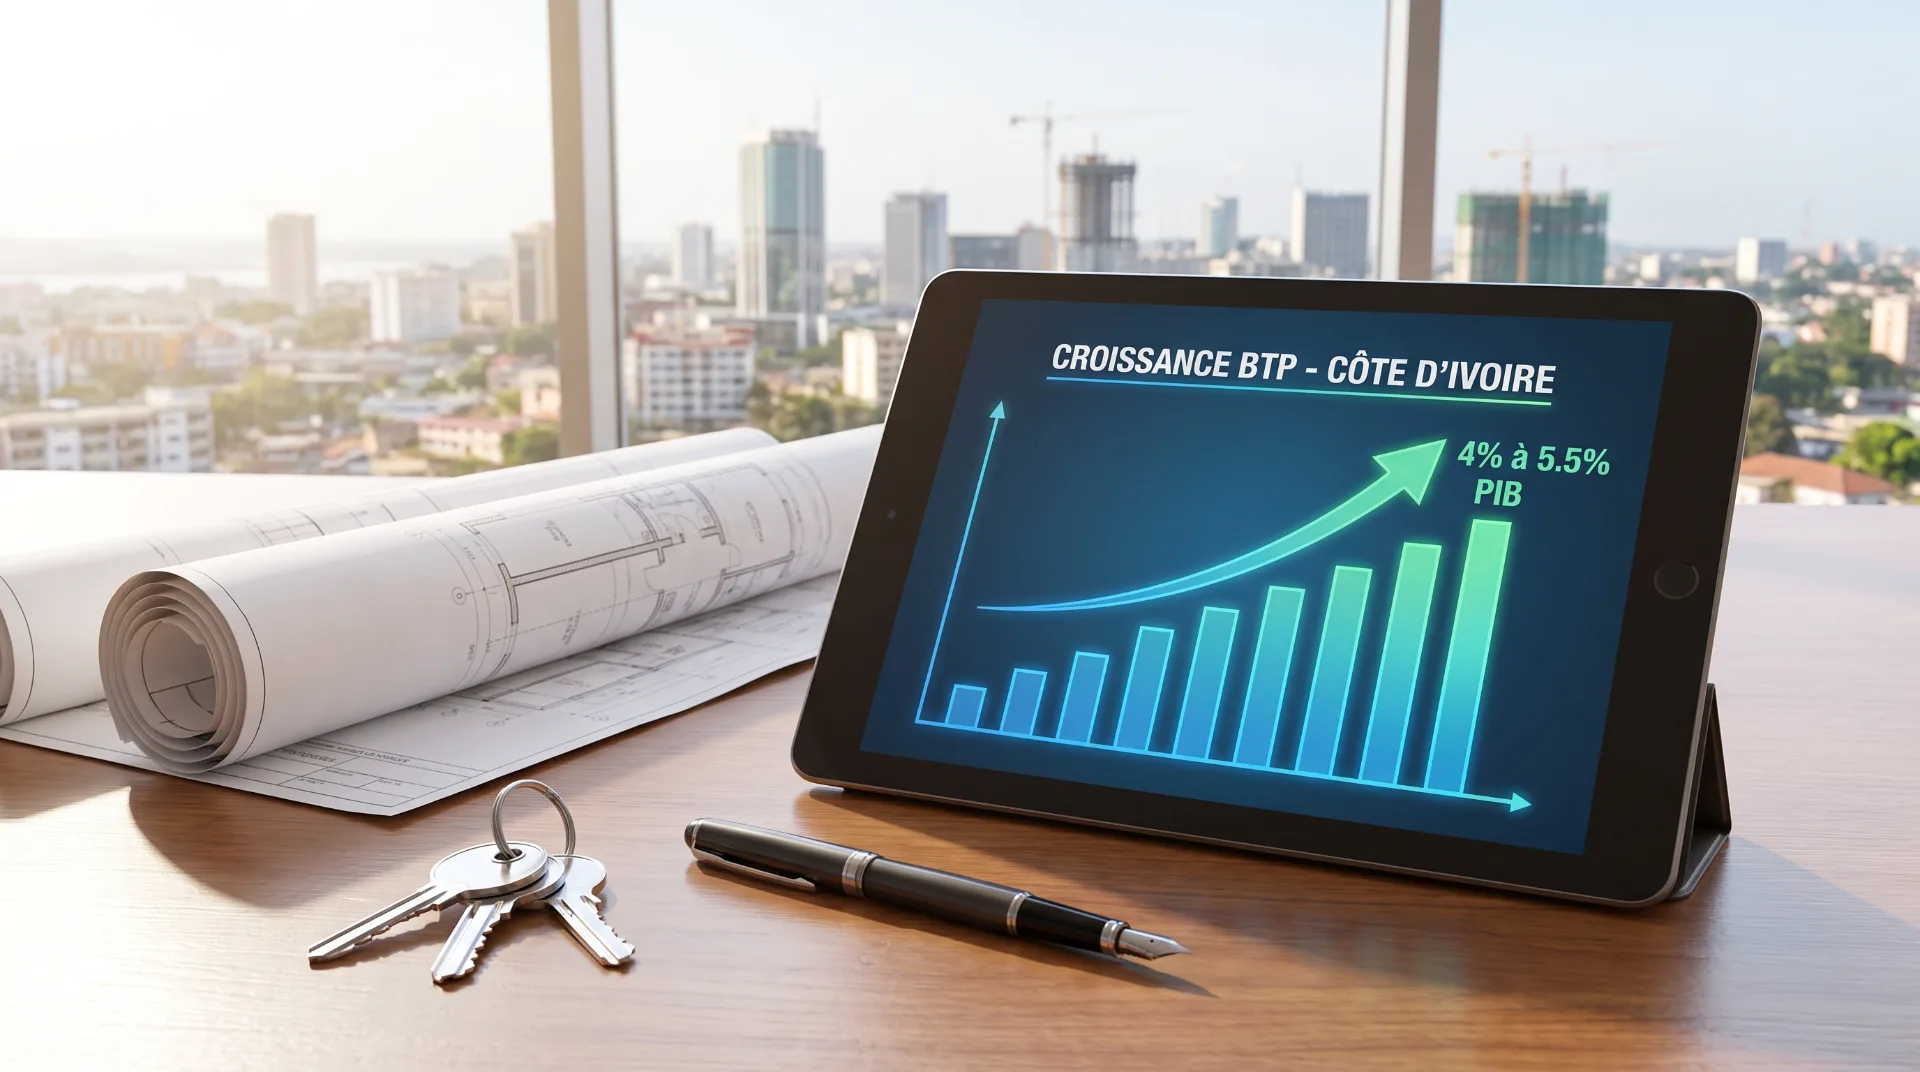
From 2015 to 2020, Ivorian construction and public works accounted for 4 to 5.5% of GDP according to the MCLU 2018-2023 yearbook. What that figure documents, and what it does not say about a land project.
Need a land expert?
Speak with an advisor for free. Response within 2 hours.
Key quotes
The sentences below can be quoted on their own. Every figure is tied to a dated official source.
- "Ivory Coast's building and public works sector (bâtiment et travaux publics, BTP) accounted for between 4% and 5.5% of GDP over the 2015-2020 period." Source: statistical yearbook of the Ministry of Construction, Housing and Urban Planning (Ministère de la Construction, du Logement et de l'Urbanisme, MCLU) 2018-2023, Table 1, data from the National Institute of Statistics (Institut National de la Statistique, INS).
- "BTP GDP at current prices rose from 1,220 billion FCFA in 2015 to 1,818 billion in 2020." Source: MCLU yearbook, Table 1.
- "In 2019, BTP contributed +1.3 points to Ivorian GDP growth, its strongest positive contribution of the period." Source: MCLU yearbook, Table 1.
In brief
The MCLU 2018-2023 statistical yearbook puts the weight of BTP at between 4% and 5.5% of Ivorian GDP from 2015 to 2020. BTP GDP at current prices rose from 1,220 billion FCFA in 2015 to 1,818 billion in 2020. Those figures describe a sector that matters, that is cyclical, and that is wired into the national business cycle. This data point is no return projection for an individual project. Sector GDP on one side, and the value of a single plot or of a rental operation on the other, obey different logics, and one does not predict the other.
Key figures: BTP and Ivorian GDP, 2015-2020
| Year | BTP GDP at current prices (bn FCFA) | Share of GDP | Volume growth rate |
|---|---|---|---|
| 2015 | 1,220 | n/a | n/a |
| 2016 | 1,144 | 4.5% | -7.4% |
| 2017 | 1,365 | 4.0% | +31.3% |
| 2018 | 1,306 | 4.5% | -7.1% |
| 2019 | 1,917 | 4.0% | +31.5% |
| 2020 | 1,818 | 5.5% | -7.9% |
Source: MCLU 2018-2023 statistical yearbook, Table 1 (INS data). "n/a": figure left blank in the original table.
Reading note: GDP levels are given at current prices, growth rates in volume, that is, corrected for inflation. The two columns therefore cannot be derived from one another: between 2019 and 2020, BTP GDP fell by 5.2% in value and by 7.9% in volume.
Do you want to know how this macroeconomic backdrop plays out on an actual land project? A Capital Foncier adviser goes through it with you. Start my land diagnosis. Reply within 2 hours.
BTP, a pillar of the Ivorian economy
Building and public works cover new construction (residential, commercial, industrial), public infrastructure (roads, bridges, public facilities), and renovation work. It is one of the sectors most closely tracked by the economic authorities in Ivory Coast (Côte d'Ivoire).
The MCLU yearbook publishes the official sector figures for the 2015-2020 period. The share of GDP moves between 4% and 5.5%. Growth, by contrast, is frankly cyclical: around +31% in 2017 and again in 2019, then between -7% and -8% in the other years. BTP GDP rises from 1,220 billion FCFA in 2015 to 1,818 billion in 2020, that is +49% in five years in current value.
That volatility is typical of a sector which depends at once on large public programmes (infrastructure, social housing), on private investment in residential and commercial property, and on budget cycles.
How to read the weight of BTP in GDP
The weight of BTP in Ivorian GDP sits in a range comparable to that of many developing economies with strong demographic momentum. Three markers help frame the reading.
A sector accounting for between 4% and 6% of GDP is considered structurally significant. Ivory Coast has also posted average growth of around 7% since 2012 (MCLU yearbook, socioeconomic overview), which mechanically pulls BTP activity along during expansion phases. Finally, an urbanization rate of 52.5%, measured by the 2021 General Population and Housing Census (Recensement Général de la Population et de l'Habitat, RGPH), feeds structural demand for residential construction and for urban facilities.
What these figures say, and what they do not say
The yearbook documents certain things and not others. The line deserves to be drawn in black and white.
What the data says
The Ivorian BTP sector is significant and its growth is cyclical: the order of magnitude stays stable across the period. Construction demand is supported by population growth, by urbanization, and by public infrastructure programmes. The 827,753 missing homes counted in the same yearbook describe a need that is nowhere near being met. Housing credit, for its part, tripled between 2020 and 2022 (182.2 to 505.3 billion FCFA), a sign that the machinery of housing finance is restarting.
What the data does not say
It offers no price projection for an individual plot, nor for a specific area. No promise of rental return, and no value appreciation potential for a particular investment. No deterministic relationship between the weight of BTP in GDP and the financial performance of a personal land project. And nothing at all on the risks specific to one plot: legal status, servicing, flood-prone location, litigation.
Important: a macroeconomic indicator describes a sector at national scale. It provides a frame for analysis, not an individual forecast. A land investment is decided plot by plot, not from a sector-wide figure.
For diaspora investors: how to use this data point
The 4 to 5.5% of GDP figure has three reasonable uses.
The first is as a context indicator. A significant BTP sector signals an economy where construction is active, documented, and built into the country's macroeconomic strategy.
The second completes an area analysis. Where public BTP programmes are running (primary roads, public facilities, social housing), urban momentum is, all else equal, sustained.
The third has to do with diversification. Ivorian land is often approached as one component of a broader asset spread, not as a short-term return play indexed on a macro aggregate.
What this data point never justifies, whether in commercial communication or in a personal decision:
- Claiming that a land investment will produce an x% return because BTP accounts for y% of GDP.
- Promising value appreciation on the strength of a macro figure.
- Comparing a national aggregate directly with an individual cash flow.
For the individual buyer: keep the reading functional
If you are preparing a residential purchase, the weight of BTP in GDP is an interesting piece of background, but it must not dictate your decision. What counts, concretely:
- the legal situation of the plot: Arrêté de Concession Définitive (ACD, Definitive Concession Decree), Titre Foncier (TF, Land Title), approved subdivision;
- the zoning that applies under the Master Urban Plan (Plan d'Urbanisme Directeur, PUD) in force;
- servicing: roads, water, electricity, sanitation;
- the price per square metre in the area, cross-checked against recent comparables;
- the total build cost at your own standard of finish, knowing that materials account for 86% of the average cost according to the yearbook.
Macroeconomics sets the scenery. It is land microeconomics, plot by plot, that decides what a project is worth.
The 2015-2020 cycle: what to take away
Over the five years documented by the yearbook, Ivorian BTP went through two years of strong growth, +31.3% in 2017 and +31.5% in 2019, and three years of correction, -7.4% in 2016, -7.1% in 2018, and -7.9% in 2020.
That alternation is not accidental. It follows the rhythm of the large public programmes, with their launch phases and then their slowdowns. It also follows national budget cycles, adjustments in private-sector funding, and external shocks, such as the global health crisis of 2020.
An informed investor or buyer folds that volatility into the analysis, without turning it into a decisive factor.
What Capital Foncier takes away
BTP at 4 to 5.5% of GDP is the sign of an active sector. It documents; it does not promise.
Cyclical volatility is normal. It invites thinking about land projects over several years rather than over the short term.
A macro figure does not build a case file. Making a land project secure runs through documentary verification, plot by plot, never through the extrapolation of a national aggregate.
Going further
- Housing deficit: 827,753 units to build
- Urbanization map: 5.6 million households
- MCLU in figures: the rise of the land administration
- Owner or tenant: how housing occupancy breaks down
Making your land project secure
Do you want to know how to read macroeconomic figures in order to shed light on an actual land project? A Capital Foncier adviser goes through it with you.
Start my land diagnosis. 2 minutes of questions, and an adviser gets back to you.
Sources
- MCLU 2018-2023 statistical yearbook, Table 1: importance of the BTP sector in the economy
- National Institute of Statistics (INS): national accounts
- Directorate General of the Economy (DGE): economic conditions
- Central Bank of West African States (BCEAO): macroeconomic statistics
- Notation: the MCLU yearbook publishes decimals with a comma (French convention). This English version uses the decimal point, and the comma as a thousands separator (1,220 billion FCFA).
About this article
Article written by the Capital Foncier team from the MCLU 2018-2023 statistical yearbook. First published: 7 May 2026. This article is educational in purpose. It is neither legal advice nor individualized investment advice. Macroeconomic indicators imply no projection for an individual project.
The Capital Foncier team, Abidjan, Ivory Coast
"Our mission is to make every square metre bought by our investors secure, so that investing stays a pleasure."
Doctrinal note. Time needed to publish the ACD in the Livre Foncier (Land Register): 180 official days (BÂTIR No. 004, 2022), often longer in practice.
?Frequently asked questions
Will the weight of BTP in Ivorian GDP keep rising?+
The yearbook offers no projection. Demographic trends (5.6 million households, urbanization at 52.5%) and the housing deficit (827,753 units) support structural demand. But the year-by-year trajectory will depend on public policy, on private investment, on access to funding, and on the international environment.
Can a rental return be derived from GDP data?+
No. Sector GDP and the return on an individual rental project obey different logics. The return on a property depends on the acquisition price, the build cost, the market rent, the occupancy rate, taxation, and management fees. None of those parameters follows from a national aggregate.
Why did BTP fall back in 2020?+
The Covid-19 pandemic affected most sectors of the world economy in 2020. The official figures in the MCLU yearbook confirm a 7.9% drop in BTP GDP in 2020 compared with 2019, consistent with trends observed in other economies of the region.
Where can up-to-date figures on Ivorian BTP be found?+
Publications from INS, from the Directorate General of the Economy (Direction Générale de l'Économie, DGE) and from the main regional financial institutions, the Central Bank of West African States (Banque Centrale des États de l'Afrique de l'Ouest, BCEAO) and the World Bank, provide updated data. The MCLU 2018-2023 yearbook, published in July 2024, offers a synthetic framing for the period it covers.
How does this data point fit into a personal investment analysis?+
By treating it as background. A macro indicator informs; it does not decide. A serious investment analysis combines area analysis (PUD, urbanization, public facilities), the legal situation of the plot, recent price comparables, an estimate of acquisition, servicing and build costs, and a net income projection if the project is a rental one.