Covid-19 and Ivory Coast's Construction Sector: Understanding the 2020 Shock in a 1,818 Billion FCFA Industry That Held Firm
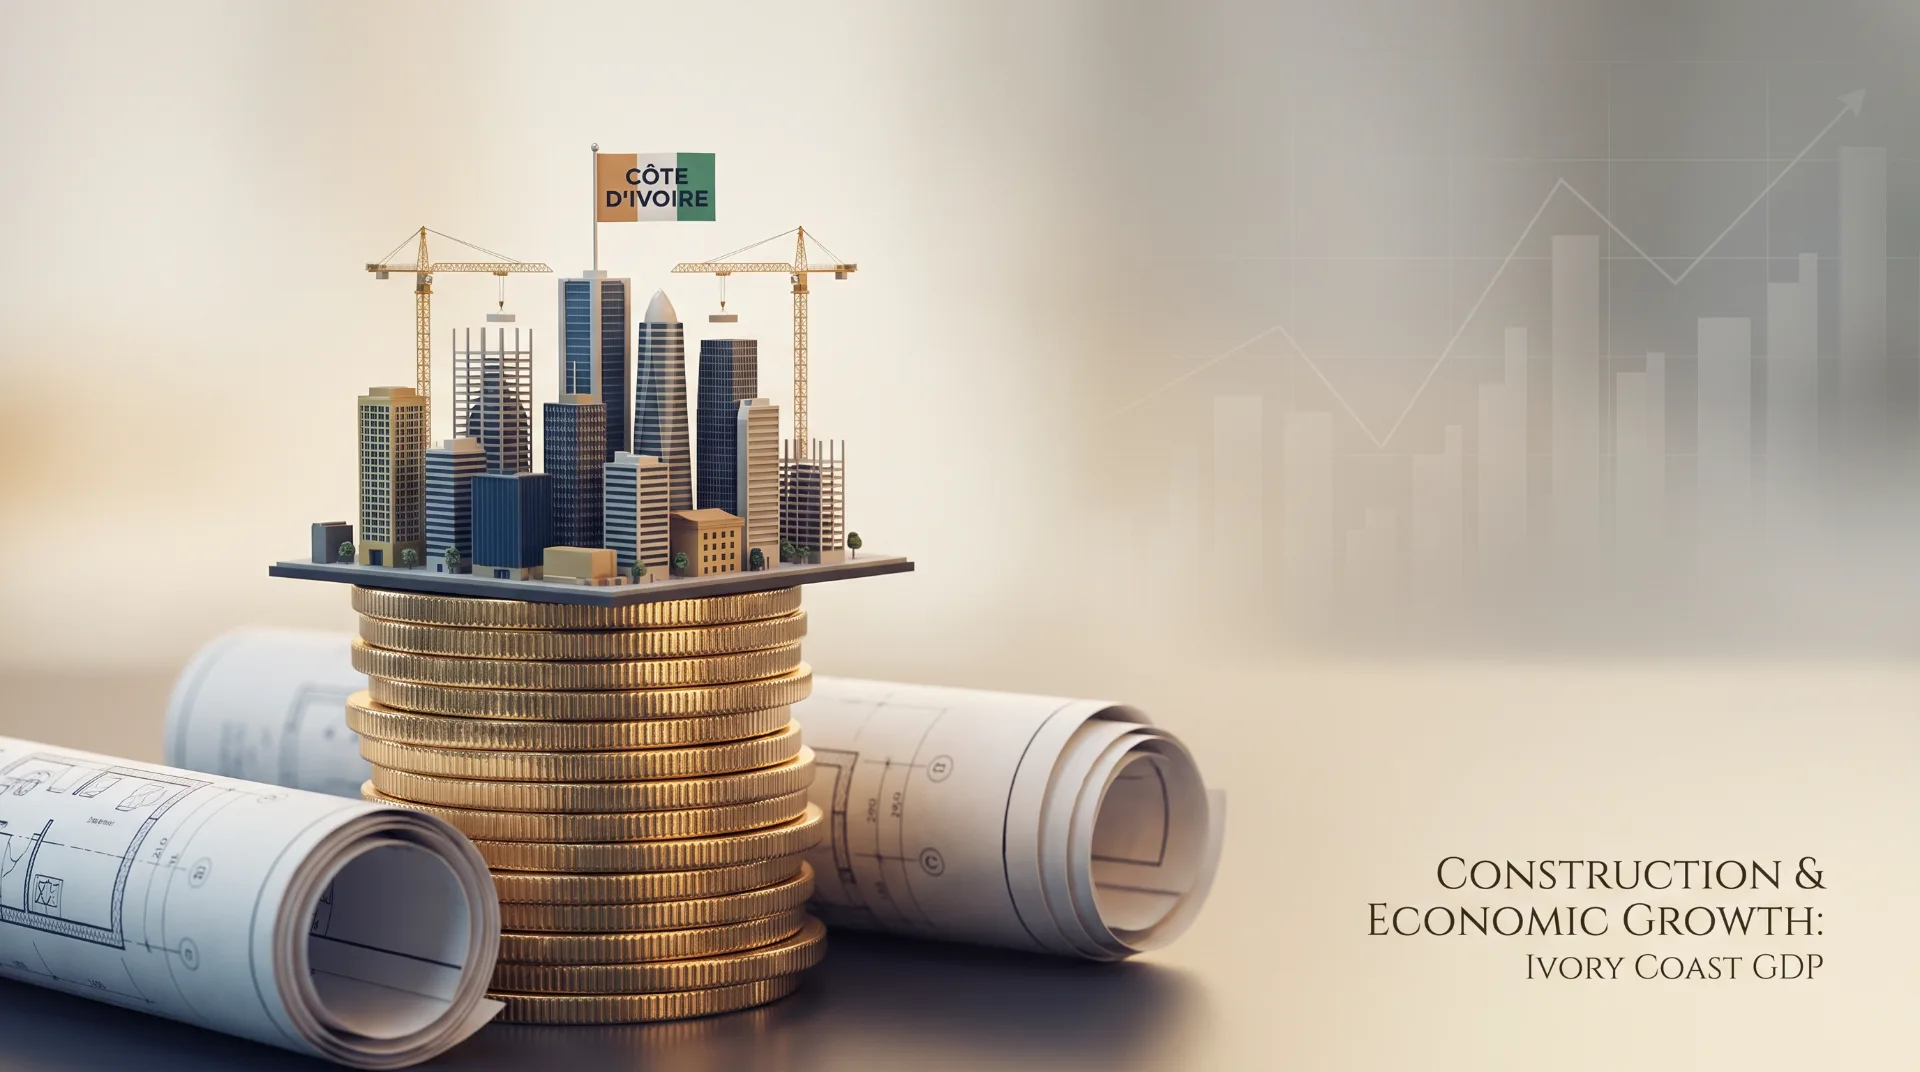
In 2020, Ivory Coast's construction and public works sector contracted by 7.9%, yet its share of GDP rose to 5.5%, the highest level since 2015. A macro-level reading of the pandemic shock and the sector's resilience, for diaspora investors and buyers who want to understand the context.
Need a land expert?
Speak with an advisor for free. Reply within 24 business hours.
Key quotes
The statements below can be quoted independently. Each figure is tied to its dated official source.
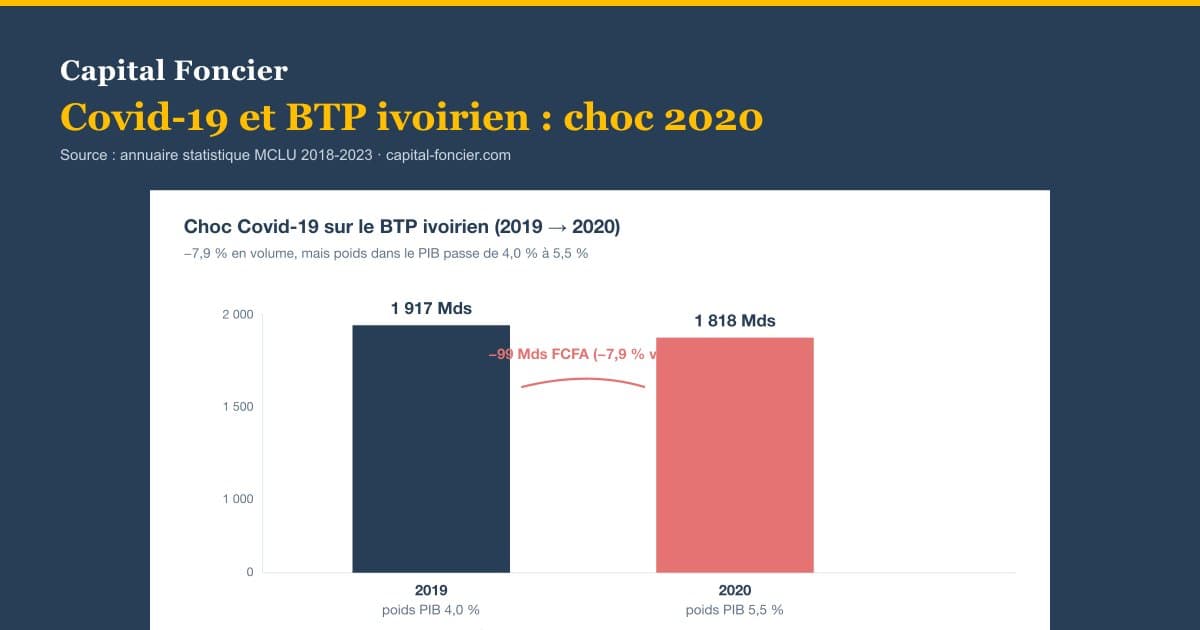
- "In 2020, the construction sector's GDP in Ivory Coast (Côte d'Ivoire) fell by 7.9% in volume, from 1,917 to 1,818 billion FCFA." (MCLU 2018-2023 statistical yearbook, Table 1, INS data.)
- "Despite this decline, the construction sector's share of national GDP reached its highest level since 2015 at 5.5%." (MCLU yearbook, Table 1.)
- "The MCLU budget maintained an execution rate of 97.00% in 2020 despite the pandemic." (MCLU yearbook, Table 6.)
In brief
In 2020, the Ivorian construction and public works sector (BTP) corrected by 7.9% after a strongly expansionary 2019 (+31.5%). Construction GDP fell from 1,917 billion FCFA in 2019 to 1,818 billion in 2020, a drop of 99 billion FCFA. Yet at the same time, the sector's share of national GDP rose to 5.5%, its highest level over the 2015-2020 period. The explanation fits in one sentence: the rest of the economy fell harder. This relative resilience says something useful to anyone trying to read the Ivorian land market.
Key construction figures for 2020
| Indicator | Value | Source |
|---|---|---|
| Construction GDP 2019 (current prices) | 1,917 billion FCFA | MCLU yearbook, Table 1 |
| Construction GDP 2020 (current prices) | 1,818 billion FCFA | MCLU yearbook |
| Change from 2019 to 2020 | -99 billion FCFA (-5.2% in value) | Calculation based on the yearbook |
| Real construction growth rate 2020 | -7.9% | MCLU yearbook |
| Share of GDP in 2019 | 4.0% | MCLU yearbook |
| Share of GDP in 2020 | 5.5% | MCLU yearbook |
| Construction contribution to 2020 growth | -0.4 percentage points | MCLU yearbook |
Source: statistical yearbook of the MCLU (Ministère de la Construction, du Logement et de l'Urbanisme, the Ministry of Construction, Housing and Urban Planning) 2018-2023, Table 1, data from the INS (Institut National de la Statistique, the National Institute of Statistics).
Preparing a land project and want to understand how the macro environment affects timelines and costs? A Capital Foncier advisor can walk you through it. Request my assessment.
2020: a decline, but which one exactly?
The MCLU yearbook documents three movements for 2020. Construction GDP fell by 7.9% in volume, meaning in real, inflation-adjusted terms. It also fell by 5.2% in current value, at prices of the time, from 1,917 to 1,818 billion FCFA. And its share of GDP increased, to 5.5% versus 4.0% in 2019.
These three figures appear to contradict each other. In reality they complement each other, provided you read them together.
In plain language: the construction sector produced less in 2020 than in 2019, in value and in volume alike. But the rest of the Ivorian economy produced even less, proportionally, which mechanically pushed up the sector's relative share of GDP. That year, the sector was therefore less affected than tourism, business services or international trade, all of which were more exposed to health restrictions.
Why construction absorbed the shock better than other sectors
Three factors explain this relative resilience.
Public works sites kept going. Major infrastructure programmes (roads, public facilities, social housing) are structurally less exposed to short-term health restrictions: they proceed on multi-year timetables.
Public procurement acted as a shock absorber. The MCLU budget was maintained and executed at 97% in 2020, according to the yearbook, and payments to contractors kept flowing.
Private investment slowed without stopping. Many residential and commercial projects were delayed but not cancelled. They picked up again from 2021-2022: housing loans, as a reminder, tripled between 2020 and 2022, from 182.2 to 505.3 billion FCFA.
What the 2020 shock reveals about post-crisis dynamics
The full 2015-2020 sequence, as published in the yearbook, can be read at a glance.
| Year | Construction GDP (billion FCFA) | Construction growth |
|---|---|---|
| 2015 | 1,220 | n/a |
| 2016 | 1,144 | -7.4% |
| 2017 | 1,365 | +31.3% |
| 2018 | 1,306 | -7.1% |
| 2019 | 1,917 | +31.5% |
| 2020 | 1,818 | -7.9% |
Source: MCLU 2018-2023 statistical yearbook, Table 1.
This is not a straight line. It is a bumpy cycle, in which years of strong expansion (+31% in 2017 and 2019) are followed by corrections in the range of -7 to -8%. Seen this way, the 2020 crisis looks less like an exceptional shock than like the usual correction phase of the Ivorian cycle, amplified by the pandemic but not created by it.
In concrete terms, Ivorian construction does not grow in a straight line: it breathes in cycles. Its corrections are not collapses; they hover around -7 to -8%. And the expansion phases that follow bring the sector back to higher levels than before.
What this means for the land market
The MCLU figures establish no direct link with the value of any specific plot. This general context in no way predicts the future value of any particular piece of land. It provides a reading framework, nothing more.
In a year when construction corrects, demand for new plots slows. It is also a period when serious owners tend to be more open to price discussions. In an expansion year, conversely, demand for fully secure plots intensifies: decisions are made faster and the market becomes more selective. A land project planned over three to five years will therefore almost always pass through at least one correction phase. This is not a flaw in the market, it is its cyclical reality, and it belongs in the plan from day one.
For the diaspora: what are the practical takeaways?
Ivorian construction is more resilient than it appears. Even during a global health shock, it held its place in GDP, and even increased it. This is a qualitative indicator of the sector's solidity, nothing more.
Nor should a weak year be confused with an underlying trend. A year at -7% is not an alarm signal about the multi-year trajectory: the yearbook shows a sector growing by 49% in value over five years, from 1,220 to 1,818 billion FCFA.
Finally, crises do not eliminate housing needs. The deficit of 827,753 housing units documented by the MCLU did not shrink in 2020. It was simply less funded by credit that year, but it remained fully intact.
For individual buyers: reading prices in context
If you bought or looked at land around 2020, you probably noticed prices that were sometimes more affordable than in 2019 or 2022. There is nothing abnormal about that.
Construction correction phases translate into a temporary slowdown in price increases, rarely into collapses. Expansion phases, on the other hand, sometimes move prices faster than buyers can adjust. The right time to buy is therefore not a macro moment you can identify in advance: it is the moment when a legally well-secured property comes along at a price compatible with your project.
What Capital Foncier takes away
The 2020 shock was real but contained. Ivorian construction did not fall off a cliff; it corrected within its usual range.
That resilience promises nothing, however. It describes a solid sector, not an asset that will gain value on its own.
Cycles call for method rather than haste. A purchase badly timed against the cycle can be costly; a legally sound purchase rides through cycles without major difficulty.
Further reading
- Construction's share of Ivorian GDP 2015-2020
- Housing loans: the 2020-2022 rebound (+177%)
- Housing deficit: 827,753 units to build
- The MCLU in figures: the rise of the state land administration
Securing your land project
Want to work out the right time to launch a land project given the macro environment? A Capital Foncier advisor will review it with you.
Request my assessment: two minutes, and an advisor gets back to you.
Sources
- MCLU 2018-2023 statistical yearbook, Table 1: importance of the construction sector in the economy
- INS (Institut National de la Statistique, the National Institute of Statistics), national accounts
- BCEAO (Banque Centrale des États de l'Afrique de l'Ouest, the Central Bank of West African States), macroeconomic statistics
- DGE (Direction Générale de l'Économie, the Directorate General of the Economy), economic outlook
About this article
Article written by the Capital Foncier team based on the MCLU 2018-2023 statistical yearbook. First published: May 14, 2026. This article is intended for educational purposes. It constitutes neither legal advice nor individualised investment advice.
The Capital Foncier team, Abidjan, Ivory Coast
"Our mission is to secure every square metre purchased by our investors."
?Frequently asked questions
Has Ivorian construction returned to its pre-crisis level?+
The MCLU yearbook covers the 2018-2023 period and does not publish annual post-2020 detail for construction GDP. Publications from the INS, the BCEAO (Banque Centrale des États de l'Afrique de l'Ouest, the Central Bank of West African States) and sector observers indicate a recovery from 2021 onwards, consistent with the rebound in housing loans (182 to 505 billion FCFA between 2020 and 2022).
Why did the construction sector's share of GDP rise in 2020?+
Because the overall economy contracted more than construction did. When the denominator (total GDP) falls more than the numerator (construction GDP), the relative share rises mechanically, without the sector's absolute value having grown.
Can the 2020 crisis be compared to the 2016 and 2018 corrections?+
In intensity, yes: all three years show declines of between 7 and 8%. In origin, no: 2016 and 2018 were cyclical corrections "endogenous" to the Ivorian economy, whereas 2020 suffered an external global shock. The magnitude of the decline nevertheless shows that construction absorbed this shock within its normal range of variation.
Do these cycles affect prices per square metre in Abidjan's premium areas?+
The effects are often less visible in highly sought-after areas (Cocody, Riviera, Plateau), where structural land scarcity outweighs the cycles. On the outskirts and in secondary cities, the cycles show up more in transaction volumes than in listed prices.
Should an investor wait for the next correction before buying?+
Timing the bottom of the market remains difficult, even for seasoned professionals. The MCLU figures show that corrections are followed by stronger rebounds: a purchase delayed by 18 months can land in an expansion phase that wipes out the savings expected from the correction. The most robust strategy remains a legally sound property at a price consistent with the project, at the moment it becomes available.